Bitcoin Price Chart Patterns: Your Essential Guide
With the volatility of cryptocurrencies, understanding price patterns on Bitcoin charts is more critical than ever. Did you know that in 2024, an estimated $4.1 billion was lost in decentralized finance (DeFi) hacks? This highlights the importance of not just trading but trading smartly. In this article, we will dive deep into the analysis of Bitcoin price chart patterns, offering valuable insights to both new and experienced traders. Let’s break it down!
Understanding Bitcoin Price Patterns
Before we jump into specifics, it’s essential to understand what price patterns are. Price patterns are typically visual representations of price movements over a specific timeframe. These patterns help traders identify potential market sentiment and future price movements. Foundationally, there are two main types of price patterns: reversal patterns and continuation patterns.
Reversal Patterns
- Head and Shoulders: Indicates a trend reversal. Look for an upward trend followed by a small peak (the left shoulder), a higher peak (the head), and a lower peak (the right shoulder).
- Double Top: Forms after an uptrend and suggests a bearish reversal, characterized by two peaks at approximately the same price level.
- Double Bottom: Indicates a bullish reversal and occurs after a downtrend, consisting of two troughs at nearly the same price level.
Continuation Patterns
- Triangles: Although they can be bullish or bearish, they usually suggest that the current trend will continue. Ascending triangles typically indicate a continuation of a bullish trend.
- Flags and Pennants: These are short-term continuation patterns suggesting that an asset will continue to move in the same direction.
- Rectangles: Formed when the price bounces between established support and resistance levels, indicating a potential breakout.
How to Analyze Bitcoin Chart Patterns
Once you are familiar with the different patterns, the next step is analysis. Analyzing these patterns requires recognizing their formation and observing market volume accompanying these movements. A large volume often confirms the strength of a pattern.

Using trading indicators, such as the Relative Strength Index (RSI) or Moving Averages (MA), can provide further confirmation of your analysis. For instance:
- If the RSI indicates an overbought condition during a double top pattern, it reinforces your bearish sentiment.
- When prices break above the resistance of a triangle pattern with an accompanying increase in volume, this confirms the continuation of the trend.
Practical Application: Analyzing the Current Market
Let’s analyze recent Bitcoin price movements using a hypothetical example from the past few months. If Bitcoin had formed a head and shoulders pattern, short traders might have entered positions at the breakdown of the neckline.
According to recent data from CoinMarketCap, Bitcoin experienced a spike from $30,000 to $60,000 in early 2024. Using our earlier head and shoulders example, a trader would have likely shorted Bitcoin around $58,000, anticipating a downward price trend.
Addressing Regional Trends: The Vietnamese Market
It’s essential to understand how local markets can affect Bitcoin prices. As of late 2024, the Vietnamese crypto market has seen a user growth rate of over 25% in digital wallets. Local traders are becoming increasingly aware of chart patterns, contributing to a shift in market dynamics.
As Vietnamese communities adopt cryptocurrencies, their trading strategies are evolving. Educational content on patterns can significantly enhance their trading decisions. Here’s the catch: when traders are equipped with the necessary knowledge, they can mitigate risks associated with volatile assets.
Key Strategies for Successful Trading
- Use Stop-Loss Orders: To minimize risk, always set stop-loss orders. This helps limit potential losses when market movements do not go as expected.
- Continuous Education: Keep updating your knowledge about market trends. Following reputable sources is vital.
- Leverage Social Trading: Engaging with experienced traders can significantly enhance your understanding of chart patterns.
Conclusion
In summary, understanding Bitcoin price chart patterns is an essential skill for any trader. By incorporating these patterns into your trading strategy and remaining aware of local market dynamics, you can make informed decisions. Remember, trading carries risks, and you should consult local regulators before making any investment.
With the right tools and knowledge at your disposal, you can navigate the complex world of Bitcoin trading proficiently. Don’t forget to check out mycryptodictionary for more tips on enhancing your crypto trading strategy. Happy trading!
Bitcoin price chart patterns” src=”/path/to/image.jpg”>
Image Description
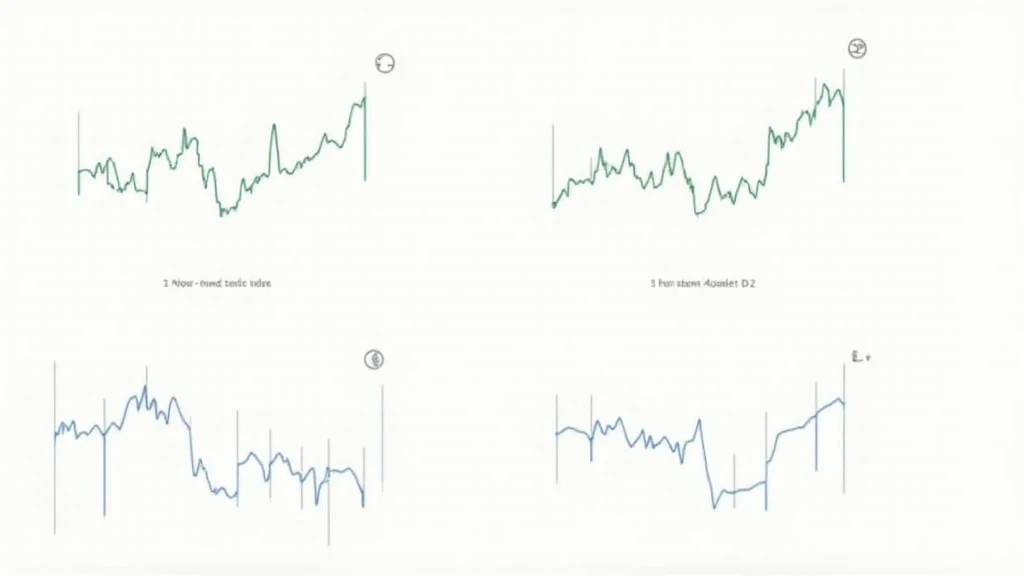
Visual representation of various Bitcoin price chart patterns illustrating key formations such as head and shoulders, double tops, and continuation patterns.


