
Understanding Bitcoin Price Chart Patterns: A Guide to Trading
As we journey through the evolving landscape of cryptocurrencies, Bitcoin remains a dominant topic in both investor discussions and market analyses. With an estimated $4.1 billion lost to DeFi hacks in 2024, understanding market trends and chart patterns is essential for anyone looking to navigate Bitcoin’s volatility effectively. This article dives deep into Bitcoin price chart patterns, aiming to equip traders and investors with the knowledge they need to make informed decisions. Whether you are a novice or an experienced trader, grasping these patterns can greatly enhance your trading strategies.
What are Chart Patterns?
Chart patterns are formations that emerge on price charts of assets over a certain period. They often indicate future price movements and are crucial for technical analysis. Traders utilize these patterns to identify potential opportunities to buy or sell. Here’s how they work:
- Trends: Chart patterns help identify whether an asset is trending upwards, downwards, or sideways.
- Reversals: Certain patterns suggest a potential reversal in the asset’s current trend.
- Continuation: Others indicate that the current trend is likely to continue.
Identifying Common Bitcoin Price Chart Patterns
Let’s break down the most recognizable Bitcoin price chart patterns:
1. Head and Shoulders
This pattern often signals a reversal in a bullish market. It consists of three peaks: a maximum (the head) between two lower peaks (the shoulders). Here’s why it’s significant:
- Formation: When price rises to a new high followed by a decline, it forms the left shoulder, followed by a new peak that forms the head, and then another decline. Finally, the right shoulder peaks before a drop.
- Implication: It usually indicates a trend reversal; thus, traders should prepare for potential selling opportunities.
2. Double Tops and Bottoms
Both double tops and bottoms represent reversal patterns, but they occur at different market conditions:
- Double Top: Identified after an uptrend, it appears as two peaks at a similar level. It indicates that the price may not break through that resistance level, leading to a potential downtrend.
- Double Bottom: Opposite of the double top, this pattern indicates a possible reversal from a downtrend to an uptrend, appearing as two troughs at a similar level.
3. Flags and Pennants
These are continuation patterns, suggesting that the current trend will likely continue after a brief pause:
- Flags: Typically appear as small rectangles that slope against the prevailing trend. After the flag formation, the price tends to continue in the direction of the trend.
- Pennants: Similar to flags, they appear like small symmetrical triangles. The price consolidates before breaking out in the direction of the previous trend.
Applying Chart Patterns in Trading Strategies
Here’s the catch: while chart patterns provide guidance, they are not foolproof. Traders need to combine chart analysis with other indicators for better accuracy. Here are some tips:
- Use Volume: Confirm patterns with trading volume. Increased volume during a breakout often affirms its validity.
- Set Stop-Loss Orders: Always protect your capital against unexpected market moves, especially in Bitcoin’s volatile environment.
- Narrow Focus: Concentrate on a few patterns that you understand well, rather than trying to master them all at once.
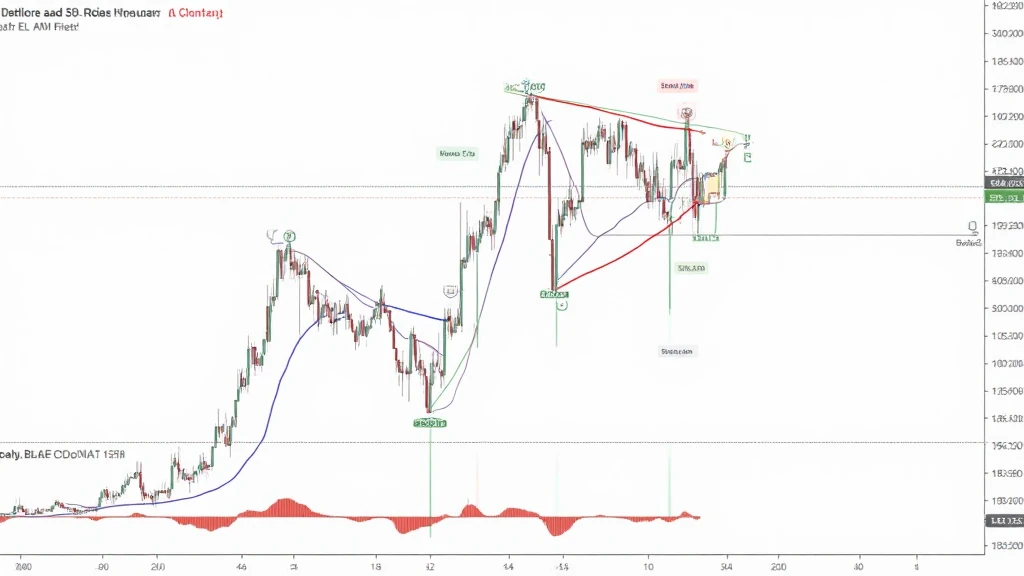
Real-World Examples of Bitcoin Chart Patterns
Understanding theoretical patterns is crucial, but seeing them in real scenarios is even more valuable. Let’s analyze a few Bitcoin price movements:
| Date | Pattern | Price Movement |
|---|---|---|
| January 2023 | Double Bottom | Price surged from $30,000 to $50,000 |
| March 2023 | Head and Shoulders | Price declined from $60,000 to $40,000 |
| June 2023 | Pennant | Price broke upwards by 20% |
The Importance of Continuous Learning and Adaptation
The cryptocurrency market is constantly evolving, and what worked last year may not yield the same results today. As of 2024, the Bitcoin user growth rate in Vietnam has surged by 45%, reflecting an increasing interest among traders and investors. To keep up:
- Follow the News: Stay updated with the latest developments in the cryptocurrency space.
- Join Forums: Participate in trading forums to learn from the experiences of others.
- Utilize Analytical Tools: Tools like TradingView provide advanced charting features that can enhance your analysis.
In conclusion, understanding Bitcoin price chart patterns is a vital skill for traders. While they do not guarantee success, knowing how to recognize them can prepare you for potential market movements. Remember to combine these patterns with fundamental analysis and other metrics to improve your decision-making process.
For those new to cryptocurrency trading or looking for advanced strategies, exploring platforms like hibt.com for additional insights can provide substantial value.
Lastly, always seek to enhance your knowledge base. Not everything in the crypto world is as it seems—there’s always more to learn and understand about Bitcoin price chart patterns.
Mycryptodictionary specializes in providing you with the tools and information necessary to succeed in the cryptocurrency market. Remember, this is not financial advice, so always consult with local regulators and professionals before making investment decisions.
Written by Dr. Alex Thompson, a cryptocurrency analyst with over 15 published papers in blockchain technology and an experienced auditor in several well-known crypto projects.