
Introduction
In the rapidly evolving world of cryptocurrency trading, understanding market behavior is crucial. With an astonishing $4.1 Billion lost to DeFi hacks in 2024, traders must adopt effective methods to enhance their market analysis. One such method is the use of candlestick patterns. These visual representations of price movements can offer insights into market trends and potential reversal points, making them an essential tool for traders.
What Are Candlestick Patterns?
Candlestick patterns are graphical representations of price movements over a specific time period. Each candlestick depicts four primary price points: open, close, high, and low. The body of the candlestick illustrates the opening and closing prices, while the wicks represent the highest and lowest prices during that timeframe.
Trading in cryptocurrencies, especially in a market that can fluctuate drastically, requires a keen understanding of these patterns. For instance, traders might use these patterns to forecast short-term price movements based on historical data.
The Importance of Candlestick Patterns
Utilizing candlestick patterns in crypto trading provides various advantages:
- Trend Confirmation: Identifying bullish or bearish trends based on candlestick patterns helps traders make informed decisions.
- Reversal Signals: Certain patterns indicate potential market reversals, allowing traders to exit or enter positions at advantageous times.
- Market Sentiment Analysis: Candlestick patterns can reflect the emotions driving price changes, each pattern telling a story of buyer and seller behavior.
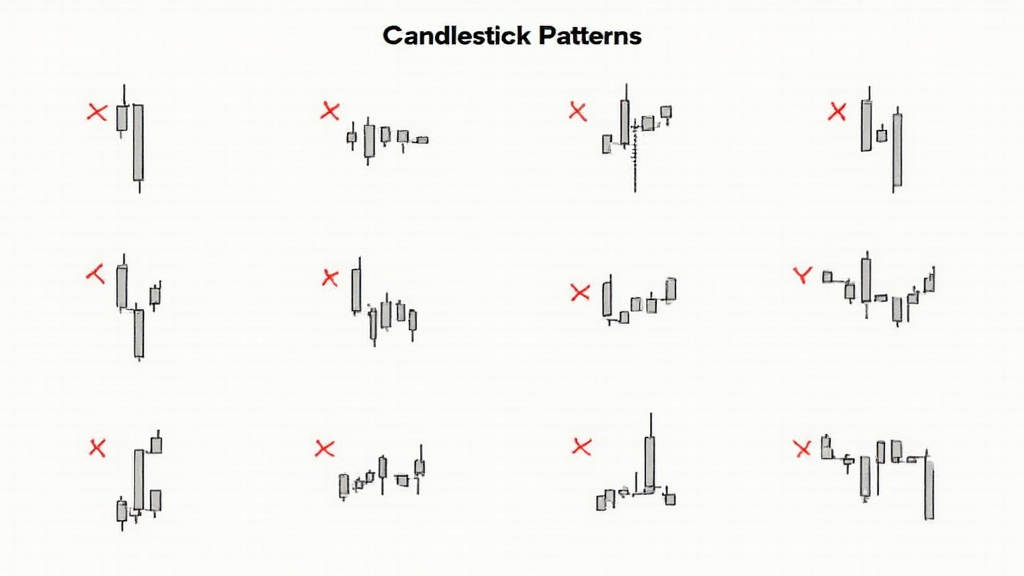
Common Candlestick Patterns in Crypto Trading
Familiarity with common candlestick patterns can enhance your trading strategy. Here are a few patterns to watch for:
1. Doji
A Doji candlestick forms when the open and close prices are nearly identical. This pattern indicates uncertainty in the market. Traders might interpret it as a potential reversal signal, especially when located at pivotal points in a trend.
2. Hammer
The Hammer pattern occurs when a small body is formed at the upper end of the price range, suggesting that buyers attempted to push prices higher, but sellers stepped in. This pattern can indicate a potential trend reversal when it appears at the bottom of a decline.
3. Engulfing Pattern
This occurs when a smaller candlestick is followed by a larger candlestick that completely engulfs it. A bullish engulfing pattern suggests a reversal from a downtrend, while a bearish engulfing pattern suggests a reversal from an uptrend.
4. Shooting Star
This pattern looks like an upside-down hammer and signals a potential price reversal after an uptrend. The long upper wick indicates that buyers pushed the price higher, but sellers eventually took control.
5. Morning Star
This three-candle formation is often seen as a bullish reversal pattern. It consists of a long bearish candle, followed by a small-bodied candle (which can be bullish or bearish), and then a long bullish candle that closes above the midpoint of the first candle.
Local Market Dynamics: Vietnam
As of 2024, Vietnam has one of the highest user growth rates in cryptocurrency markets in Southeast Asia. According to recent reports, around 15% of the Vietnamese population has ventured into cryptocurrency trading, showcasing a significant uptick in market interest. Understanding local investor behavior can aid traders in leveraging candlestick patterns effectively in this dynamic market.
Utilizing Candlestick Patterns in the Vietnamese Market
For traders focusing on the Vietnamese market, recognizing cultural factors and market conditions is vital. Due to the inherent volatility of cryptocurrencies, combining candlestick analysis with local economic news can enhance trading strategies.
Moreover, market participants in Vietnam often exhibit a mix of speculative trading and long-term investments, leading to unique candlestick formations stemming from local events and investor sentiment.
Strategies for Success with Candlestick Patterns
Candlestick patterns should be used in conjunction with other forms of technical and fundamental analysis. Here’s how to integrate candlestick analysis into your trading strategy:
- Combine Patterns with Indicators: Use technical indicators like Moving Averages or Relative Strength Index (RSI) to confirm signals from candlestick patterns.
- Develop a Trading Plan: Establish clear entry and exit points based on candlestick signals, and stick to your plan to avoid emotional trades.
- Stay Updated on Market News: Keeping an eye on regulatory news or market developments in Vietnam can help contextualize candlestick patterns and make informed decisions.
Conclusion
Mastering candlestick patterns can significantly enhance your crypto trading strategies. By effectively analyzing these patterns and combining them with market insights, traders can make more informed decisions. As the cryptocurrency landscape continues to shift, leveraging tools such as candlestick charts will remain vital for navigating this exciting market.
At mycryptodictionary, we are committed to providing traders with resources to understand market trends and enhance their trading expertise. Be sure to utilize candlestick patterns to elevate your trading game!
Author: Dr. Patricia Nguyen
Dr. Patricia Nguyen has published over 25 papers in financial technology and serves as a lead auditor on several notable blockchain projects.